Within Name Claim
When true numbers point to false causes
A number may be accurate while the post around it pushes readers toward a cause the evidence does not support.
On this page
- Separate the statistic from the causal claim
- Check definitions, dates, and comparison groups
- Look for missing context before accepting the implication
Page outline Jump by section
Introduction
A statistic can be completely accurate and still support a misleading conclusion. This happens when a post presents a real number, trend, or correlation and then quietly adds a stronger claim about why that pattern exists. The number may survive fact-checking, yet the implied cause may not. In social media and AI-generated content, this is a common way misinformation spreads: the data are real, but the explanation is speculative, incomplete, or wrong.
 The key critical-thinking move is to separate the statistic from the causal claim. A post that says “X increased after policy Y” is making two different statements: that X increased, and that policy Y caused the increase. The first may be true while the second remains unproven. Statisticians have long warned that association alone does not establish cause and effect. [RSS+2European Data Portal]rss.org.ukOpen source on rss.org.uk.
Separate the number from the explanation
When readers encounter a striking statistic, they often focus on whether the number is accurate. Misleading posts rely on this habit.
Consider a claim such as:
Crime rose by 15% after a new policy was introduced.
Even if the percentage is correct, the post may be assuming that the policy caused the increase. The rise could instead be linked to economic conditions, reporting changes, demographic shifts, seasonal effects, or several factors operating together. The statistic describes what happened; it does not automatically explain why it happened. [Wiley Online Library]onlinelibrary.wiley.comWiley Online LibraryCausal Inference With Observational Data and…Jan 21, 2025 — The major challenge using observational data for causa…
This distinction matters because humans naturally look for stories. A chart showing two lines moving together often feels like evidence of a direct relationship. Yet a statistical association is only the starting point of an investigation, not the end of one. [BYU-Idaho Video]video.byui.edu1 ppf85mk4BYU-Idaho VideoCorrelation vs Causation: A Brief Guide To Communicating…Apr 21, 2025 — Professor David Spiegelhalter explains why corr…
Why real data can suggest false causes
Several mechanisms allow true statistics to create false impressions about causation.
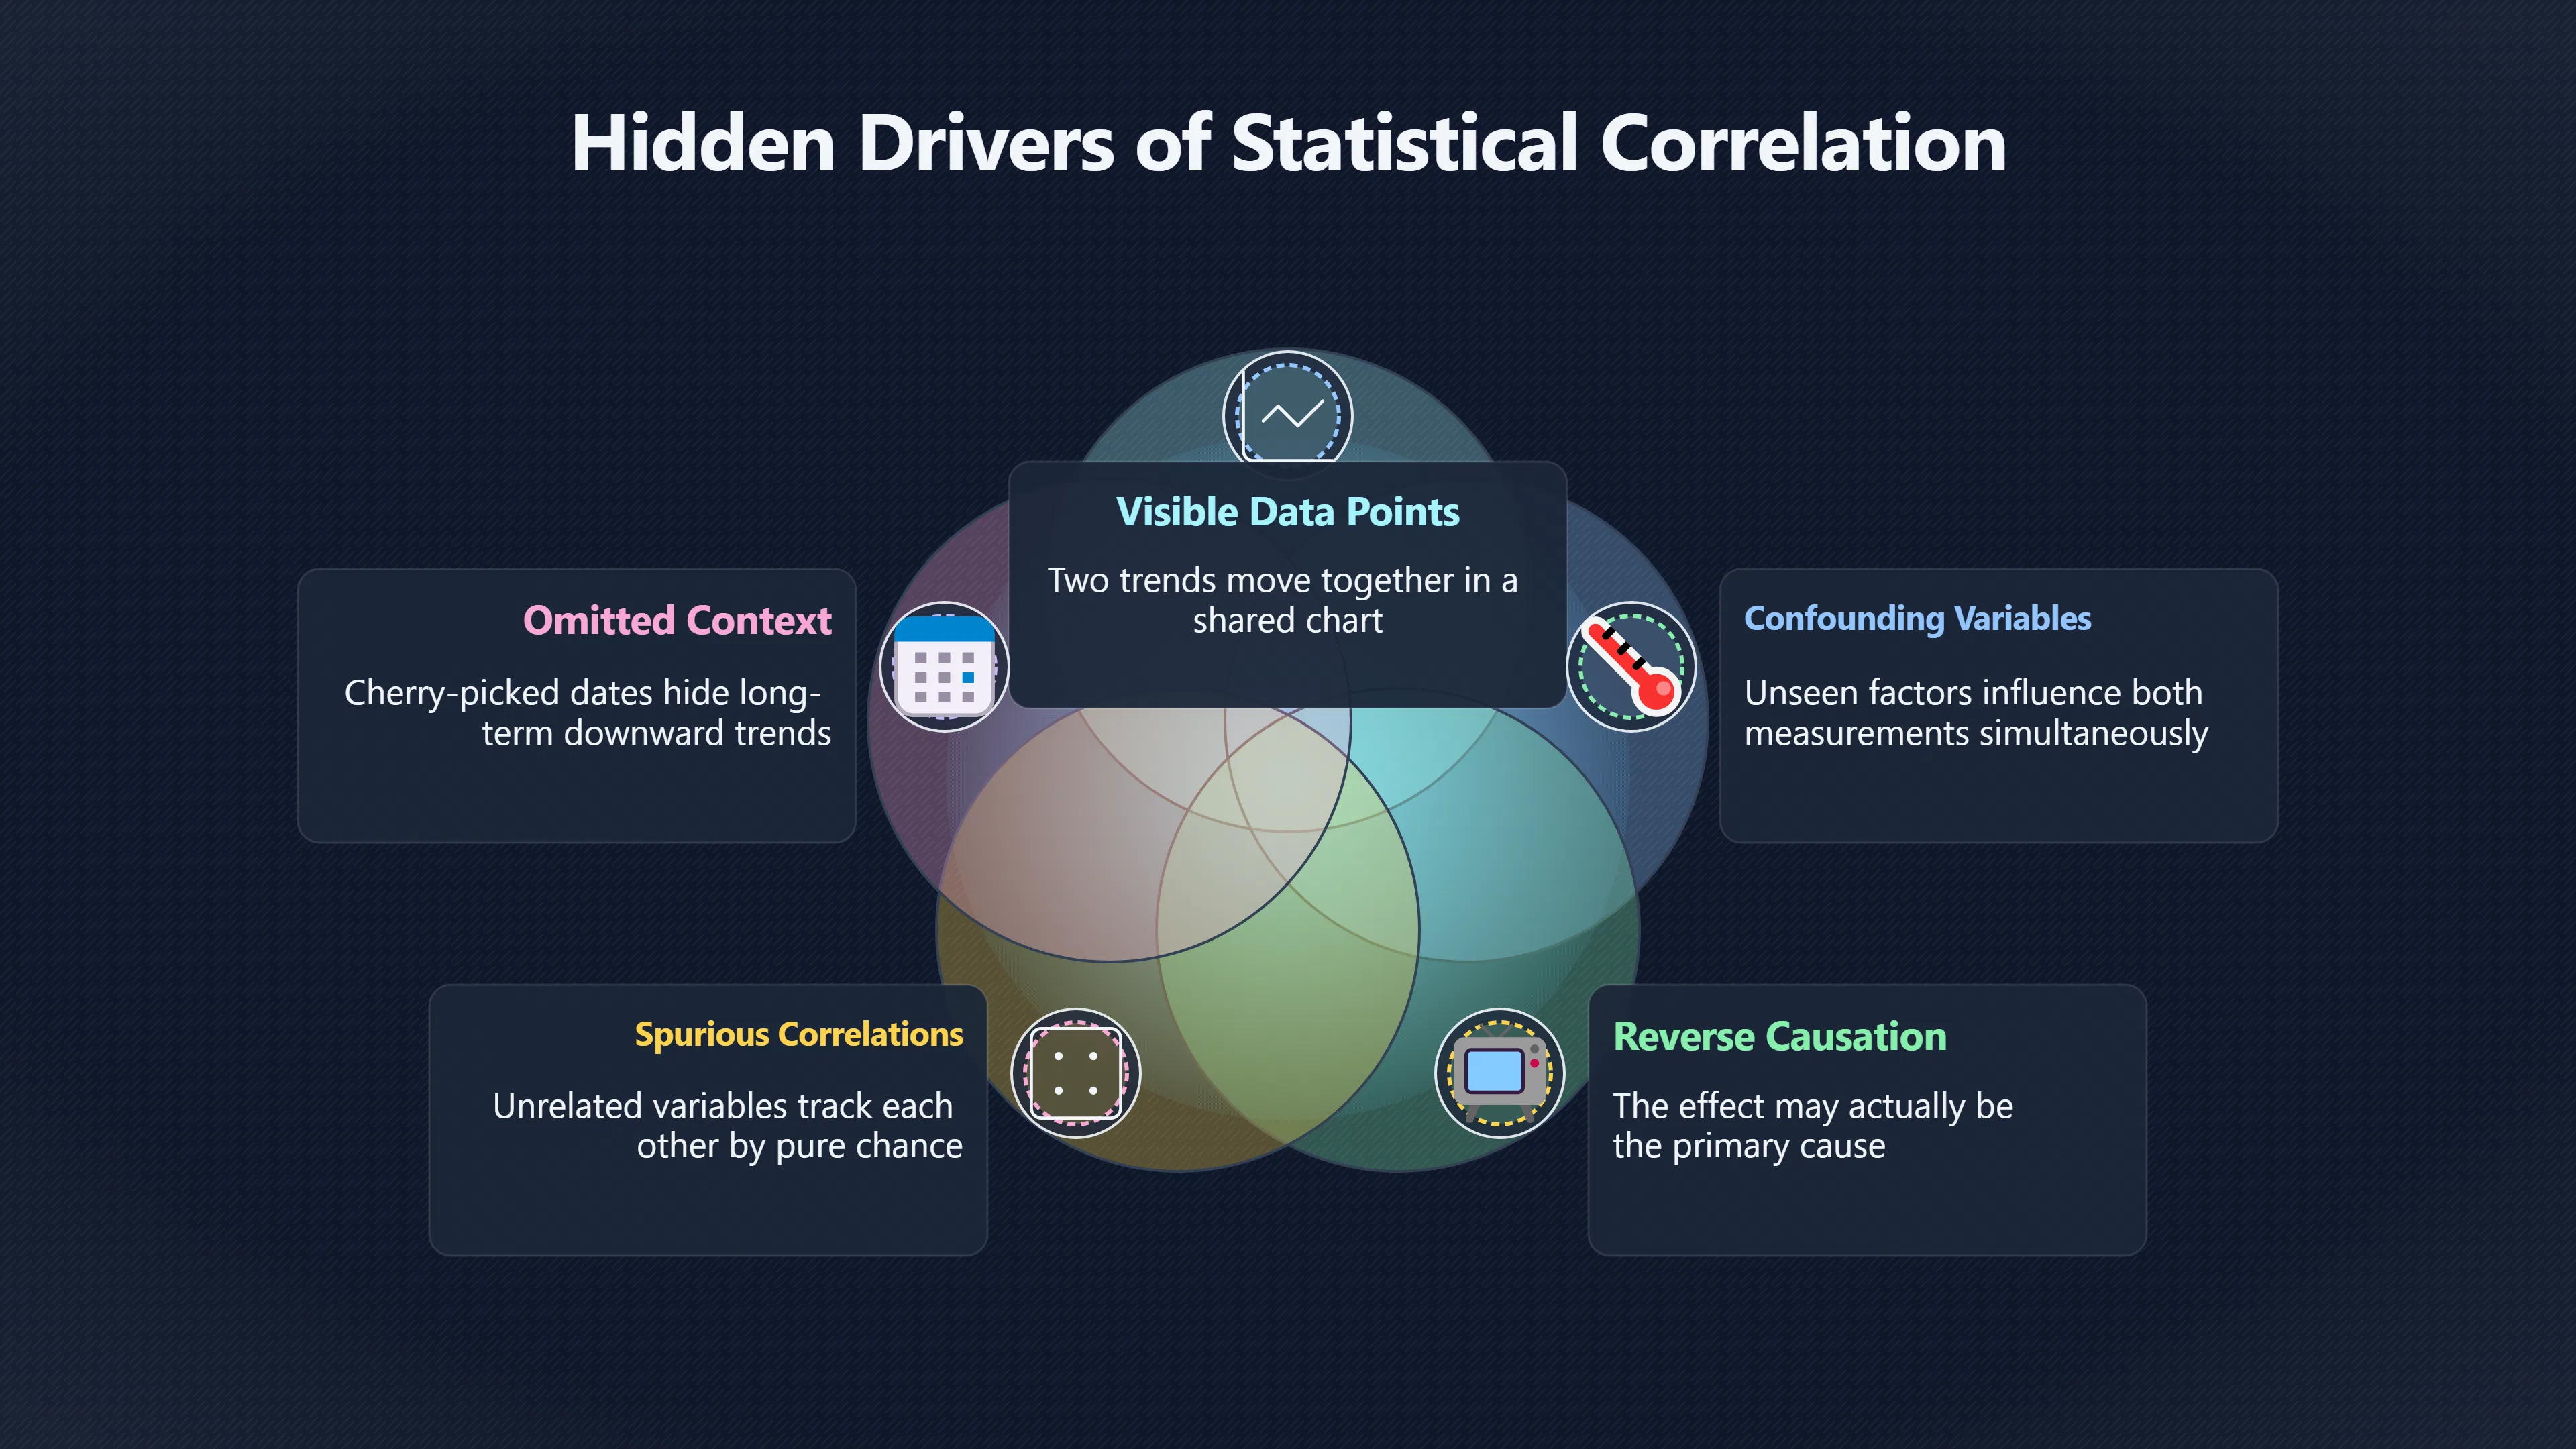
A hidden third factor may drive both trends
One of the most common errors involves a confounding variable: an unseen factor influencing both measurements.
A classic example is the relationship between ice cream sales and drowning deaths. Both tend to rise during warmer months. The data show a genuine association, but buying ice cream does not cause drowning. Higher temperatures increase both swimming activity and ice cream consumption. The hidden factor is the season and weather, not a direct causal link between the two variables. [Wikipedia+2Statsig]WikipediaCorrelation does not imply causationCorrelation does not imply causation
Social media posts often exploit this pattern. They present two trends that move together and encourage readers to assume one caused the other without investigating alternative explanations.
Cause and effect may be reversed
Sometimes a relationship exists, but the direction is unclear.
A post might claim that people who consume more news become more anxious. The data could show a genuine association, yet it is also possible that anxious people seek out more news. Without evidence about direction, the statistic alone cannot settle the question. Statisticians refer to this as the problem of reverse causation. [Wikipedia]WikipediaCorrelation does not imply causationCorrelation does not imply causation
The relationship may be partly coincidence
With enough data, surprising correlations appear by chance. Collections of so-called “spurious correlations” demonstrate that unrelated variables can track each other closely for a period of time despite having no meaningful connection. [tylervigen.com]tylervigen.comSpurious CorrelationsCorrelation is not causation: thousands of charts of real data showing actual correlations between ridiculous variables…
This becomes especially relevant in an era of large datasets and AI systems that can detect patterns faster than humans. Finding a pattern is easier than demonstrating a cause. Large amounts of data increase the opportunity to discover correlations that look convincing but have no causal significance. [riskinsights.com.au]riskinsights.com.auMore data, more correlations – but is it causation?Risk InsightsAug 28, 2025 — Understanding how more data can lead to misleading correlations and the importance of discerning real causati…

Check definitions, dates, and comparison groups
Misleading causal claims often depend on details that are easy to overlook.
Definitions can change
Suppose a post claims that a category of incidents doubled over five years. Before accepting the implied explanation, check whether the definition of the category remained constant. Changes in reporting standards, data collection methods, or classification rules can produce apparent increases that do not reflect the underlying phenomenon.
A true statistic measured under changing definitions may support a misleading narrative about causes.
Dates matter
Timing alone does not prove causation.
A post may show that an event occurred shortly after a policy change, technological release, or social movement. But events that happen after something are not necessarily caused by it. The sequence may be real while the causal interpretation remains unsupported. Statisticians distinguish between “after this” and “because of this” for precisely this reason. [Wikipedia]WikipediaCorrelation does not imply causationCorrelation does not imply causation
Comparison groups may be missing
A statistic presented without a relevant comparison group can create a false impression.
Imagine a post reporting that a city experienced a rise in unemployment after introducing a local programme. If neighbouring cities experienced the same increase during the same period, the local programme becomes a less convincing explanation. Without comparison groups, readers cannot judge whether a trend is unusual or part of a broader pattern. [Wiley Online Library]onlinelibrary.wiley.comWiley Online LibraryCausal Inference With Observational Data and…Jan 21, 2025 — The major challenge using observational data for causa…
Look for missing context before accepting the implication
Many viral claims depend less on false numbers than on omitted context.
A graph may begin at a convenient date, making a recent increase appear dramatic while hiding a longer-term decline. A percentage may sound alarming until readers learn the underlying numbers are very small. A correlation may appear persuasive until a broader dataset reveals the relationship disappears when additional factors are considered. The Royal Statistical Society specifically highlights issues such as cherry-picking, oversimplification, and confusion between correlation and causation as common problems in social-media statistics. [RSS]rss.org.ukOpen source on rss.org.uk.
When evaluating a claim, useful questions include:
- What exactly does the statistic measure?
- Does the statistic establish a pattern or a cause?
- Could another factor explain both observations?
- Is there a relevant comparison group?
- Are important dates, definitions, or exclusions missing?
- Would the same conclusion hold if more context were included?
These questions help prevent a common mistake: treating evidence that something happened as evidence explaining why it happened.

Why this matters in the age of social media and AI
Modern information systems reward compelling narratives. A post that says “this number increased” attracts attention; a post that says “here is the likely cause” attracts even more. AI tools can rapidly generate persuasive explanations around real statistics, and social platforms can spread those explanations before anyone examines whether the causal story is justified.
The result is a form of misinformation that is harder to detect than an outright falsehood. The numbers may be genuine. The graph may be authentic. The dataset may be real. The weakness lies in the leap from observation to explanation.
Critical thinking therefore requires two separate checks. First, ask whether the statistic is accurate. Then ask whether the claimed cause is actually supported by evidence. A true number answers the first question. It does not automatically answer the second. [BYU-Idaho Video+2European Data Portal]video.byui.edu1 ppf85mk4BYU-Idaho VideoCorrelation vs Causation: A Brief Guide To Communicating…Apr 21, 2025 — Professor David Spiegelhalter explains why corr…
Amazon book picks
Further Reading
Books and field guides related to When true numbers point to false causes. Use these as the next step if you want deeper reading beyond the article.
The Book of Why
Directly explains why correlations and true statistics do not automatically establish causes.
Calling Bullshit
Covers misleading statistics, causation errors, and data-driven claims.
How to Lie with Statistics
Shows how accurate numbers can create misleading impressions.
Factfulness
Encourages careful interpretation of data and challenges misleading narratives.
eBay marketplace picks
Marketplace Samples
Example marketplace items related to this page. Use the search link to explore similar finds on eBay.


Endnotes
-
Source: rss.org.uk
Link: https://rss.org.uk/resources/resources-for-public/guide-to-statistics-on-social-media/ -
Source: onlinelibrary.wiley.com
Link: https://onlinelibrary.wiley.com/doi/10.1111/ele.70023Source snippet
Wiley Online LibraryCausal Inference With Observational Data and...Jan 21, 2025 — The major challenge using observational data for causa...
-
Source: Wikipedia
Title: Correlation does not imply causation
Link: https://en.wikipedia.org/wiki/Correlation_does_not_imply_causation -
Source: statsig.com
Link: https://www.statsig.com/perspectives/correlation-not-causation-examples-tipsSource snippet
Correlation does not equal causation: classic examples & tips20 Mar 2025 — One famous example is the link between ice cream sales...
-
Source: Wikipedia
Title: Misuse of statistics
Link: https://en.wikipedia.org/wiki/Misuse_of_statisticsSource snippet
Misuse of statisticsStatistics, when used in a misleading fashion, can trick the casual observer into believing something other than w...
-
Source: tylervigen.com
Link: https://www.tylervigen.com/spurious-correlationsSource snippet
Spurious CorrelationsCorrelation is not causation: thousands of charts of real data showing actual correlations between ridiculous variables...
-
Source: riskinsights.com.au
Title: More data, more correlations – but is it causation?
Link: https://riskinsights.com.au/blog/more-data-more-correlations-but-is-it-causationSource snippet
Risk InsightsAug 28, 2025 — Understanding how more data can lead to misleading correlations and the importance of discerning real causati...
-
Source: tylervigen.com
Title: AI explanation.Read more
Link: https://tylervigen.com/spurious/correlation/9632_ice-cream-consumption_correlates-with_violent-crime-ratesSource snippet
Ice cream consumption correlates with Violent crime rates...Spurious correlation #9,632 · View random · A linear line chart with years a...
-
Source: rss.onlinelibrary.wiley.com
Title: j.1467 985X.2011.01030.x
Link: https://rss.onlinelibrary.wiley.com/doi/abs/10.1111/j.1467-985X.2011.01030.xSource snippet
wiley.comCausality, mediation and time: a dynamic viewpoint - Aalenby OO Aalen · 2012 · Cited by 142 — Journal of the Royal Statistical S...
-
Source: data.europa.eu
Link: https://data.europa.eu/apps/data-visualisation-guide/correlation-is-not-causationSource snippet
European Data PortalCorrelation is not causationCorrelation does not mean causation. When two variables are correlated, this does not nec...
-
Source: video.byui.edu
Title: 1 ppf85mk4
Link: https://video.byui.edu/media/t/1_ppf85mk4Source snippet
BYU-Idaho VideoCorrelation vs Causation: A Brief Guide To Communicating...Apr 21, 2025 — Professor David Spiegelhalter explains why corr...
-
Source: rss.org.uk
Title: west midlands local group the statistics and metap
Link: https://rss.org.uk/news-publication/news-publications/2020/section-group-reports/west-midlands-local-group-the-statistics-and-metap/Source snippet
West Midlands Local Group: The statistics and metaphysics...Jan 9, 2020 — Professor Papineau began by discussing the history of the stud...
-
Source: rss.org.uk
Link: https://rss.org.uk/news-publication/publications/law-guides/Source snippet
Statistics law guidesStatistical guides. The RSS Statistics and the Law Section has produced several guides for law practitioners a...
-
Source: rss.org.uk
Title: making sense of election statistics – what voters
Link: https://rss.org.uk/news-publication/news-publications/2026/general-news/making-sense-of-election-statistics-%E2%80%93-what-voters/Source snippet
need to...1 Apr 2026 — As the election approaches, our guide aims to equip voters with practical tools to interpret the numbers they enc...
-
Source: scribbr.com
Title: Correlation vs
Link: https://www.scribbr.com/methodology/correlation-vs-causation/Source snippet
Causation | Difference, Designs & ExamplesJul 12, 2021 — Correlation means there is a statistical association between variables. Causatio...
-
Source: abs.gov.au
Title: correlation and causation
Link: https://www.abs.gov.au/statistics/understanding-statistics/statistical-terms-and-concepts/correlation-and-causationSource snippet
Feb 2, 2023 — Correlation is a statistical measure (expressed as a number) that describes the size and direction of a relationship betwee...
-
Source: libguides.ntu.edu.sg
Title: ntu.edu.sg Common Data Fallacies
Link: https://libguides.ntu.edu.sg/visualisingdata/datafallaciesSource snippet
The two events may not be related at all but correlate by chance or by an unknown third factor...Read more...
Additional References
-
Source: otexts.com
Link: https://otexts.com/fpp3/causality.htmlSource snippet
7.8 Correlation, causation and forecastingSo the two variables (ice-cream sales and drownings) are correlated, but one is not causing the...
-
Source: mathmedic.com
Link: https://mathmedic.com/blog/correlation-does-not-mean-causation/Source snippet
Correlation Does Not Mean CausationThis is known as common response, where two variables (ice cream sales and shark attacks) are both res...
-
Source: merriam-webster.com
Link: https://www.merriam-webster.com/dictionary/exampleSource snippet
EXAMPLE Definition & MeaningThe meaning of EXAMPLE is a person or way of behaving that serves as a pattern to be imitated or not to be im...
-
Source: linkedin.com
Link: https://www.linkedin.com/posts/quentin-gallea-phd_we-identify-a-critical-mistake-the-tendency-activity-7389554270112600064-BSbsSource snippet
"Big Data Fallacy: Correlation Does Not Imply Causation""We identify a critical mistake: the tendency to erroneously infer causation from...
-
Source: medium.com
Link: https://medium.com/%40kording/why-correlation-isnt-causation-in-brain-data-be20c76522ddSource snippet
Why Correlation Isn't Causation in Brain DataThe observed correlations in brain signals are far from a straightforward window into causat...
-
Source: merriam-webster.com
Link: https://www.merriam-webster.com/dictionary/ourSource snippet
OUR Definition & MeaningThe meaning of OUR is of or relating to us or ourselves or ourself especially as possessors or possessor, agents...
-
Source: ourworldindata.org
Link: https://ourworldindata.org/ -
Source: linkedin.com
Link: https://www.linkedin.com/posts/aditya-rai-ds_datascience-statistics-causation-activity-7427207263045660672-xgocSource snippet
Ice cream sales go up. Shark attacks go up. Does ice cream cause shark attacks? Of course not. Both increase because...Read more...
-
Source: biologyforlife.com
Title: “Correlation does not imply causation”CAUSATION = Firemen cause fire
Link: https://www.biologyforlife.com/uploads/2/2/3/9/22392738/01_correlation_does_not_imply_causation.pdfSource snippet
Page 3. CORRELATION: As ice cream sales increase, the rate of drowning deaths increases sharply. CAUSATION = Ice cream causes.Read more...
-
Source: andreasrmadsen.medium.com
Title: a story of ice cream drowning and causal modelling fff3967f7671
Link: https://andreasrmadsen.medium.com/a-story-of-ice-cream-drowning-and-causal-modelling-fff3967f7671Source snippet
story of ice-cream, Drowning and causal modelling.Correlation does not imply causation. The next thing you then will learn is that: Corre...
Topic Tree